New Three-Dimensional Organization of
Chromosome Territories and the Human Cell Nucleus:
About the Structure of a Self Replicating Nano Fabrication Site
Tobias A. Knoch*, Christian Münkel and Jörg Langowski
Division Biophysics of Macromolecules, German Cancer
Research Center, Heidelberg, Germany
The work is part of the Heidelberg 3D Human Genome Study
Group, which is part of the German Human Genome Project.
This is an abstract
for a presentation given at the
Sixth
Foresight Conference on Molecular Nanotechnology.
There will be a link from here to the full article when it is
available on the web.
The eukaryotic cell is a prime example of a functioning nano machinery. The synthesis of proteins, maintenance of structure and duplication of the machinery itself are all fine-tuned biochemical processes that depend on the precise structural arrangement of the cellular components. In particular the regulation of genes has been shown to be closely connected to the organization of the genome in the nucleus. Despite the successful linear sequencing of the human genome its three-dimensional structure is widely unknown. Here we show studies leading to new insights about the organization of chromatin into chromosomal territories and their integration into a whole nucleus. Thus in an anology to the Bauhaus principle that "form follows function", analyzing in which form DNA is organized might not only help us to understand genomic function but also will help us to construct complex and optimized nano fabrication sites.
Research on the three dimensional structures of genomes has been obstructed by the incapabilities of imaging systems: Methods with high spatial resolution (e. g. electron microscopy) partialy destroy the structure while in light microscopy where the structure is preserved only low spatial resolution is reached. At the turn of the century, Carl Rabl (1895) and Theodori Boveri (1909) had already postulated a separation of chromosomes into distinct territories in the interphase, i. e. between cell divisions, from studies involving light microscopy. But later, especially since the advent of electron microscopy, the cell nucleus has been viewed as a 'spaghetti soup' of DNA bound to various proteins without much internal structure (Comings et al., 1984) except during metaphase, i. e. cell division, when chromosomes are condensed into separate entities. Only recently has it become apparent that chromosomes occupy distinct 'territories' also in the interphase (Zirbel et al., 1993; see also Fig. 2). This can be granted to the development of fluorescent in situ hybridization (FISH) and confocal laser scanning microscopy (CLSM). In FISH cell nuclei are fixed and after melting the DNA double helix a complementary probe of single stranded and fluorescently labeled DNA is added. While diffusing through the nucleus the probe finds its complementary target sequence and binds with high affinity. The territories being rather compact regions of the nucleus, the hypothesis has been forwarded that active genes are transcribed mainly at the periphery, and macromolecules (i. e. transcripts and proteins) are transported in a hypothetical space between adjacent and nonoverlapping territories. However, the postulated intrachromosomal domain (ICD, Cremer et al., 1993) channels have never been directly visualized. The distribution of the chromatin fiber within a chromosome territory is also far from random. Several theoretic descriptions of chromosome structure based on polymer-chain models of the chromatin fiber have been postulated. These can be compared to experimental data obtained by marking small genomic targets with FISH and measuring the spatial distance between these markers as a function of their genomic (i. e. linear sequence) distance. Based on such experiments, Sachs proposed the so-called Random-Walk/Giant-Loop (RW/GL) model (Sachs et al., 1994). In the RW/GL—model big chromatin loops with a base pair content of around 3 to 5 million are bound to a nuclear matrix. However, whether a nuclear matrix exists or not is still an unresolved question.
We developed the so-called Multi-Loop-Subcompartment
(MLS) model for solving some contradictions of the RW/GL-model (Muenkel
et al., 1998). Here the chromatin fiber folds into ~120kbp sized
loops which again are forming rosettes of in total 1—2 Mbp. These
rosettes are interconnected by a piece of chromatin of similar basepair
content so that no protein matrix is needed for structural support.
Rosettes in the MLS-model correspond to the size of chromosomal interphase
band domains. This model leads also to an easy mechanism for
decondensation (or condensation) of a chromosome from metaphase: A loop is
opened (or formed) at its base (e. g. protein mediated connection). This
model also agrees with the metaphase organization as proposed by Pienta
and Coffey (1984).
Simulation Methods:
Using Monte Carlo and Brownian Dynamics methods, we simulated various models of human interphase chromosome 15 assuming a flexible polymer chain. To each segment we assigned a harmonic stretching potential and between two segments a harmonic bending potential. To avoid self-crossing of the polymer chain a short ranged excluded volume potential was introduced. Its potential barrier can be changed to facilitate chain disentanglement. In vivo this is mediated by Topoisomerase II. The starting configuration of a chromosome has the approximate form and size of a metaphase chromosome decondensation into interphase resembles the natural process (Fig. 1, above). To decrease computation time we started with polymer segments of 300 nm (~31,000 bp) corresponding to 3300 segments for chromosome 15. Typically ~400,000 Monte Carlo steps are needed to generate enough statistically independent configurations at equilibrium. For comparison with experimental data at small genomic distances the Monte Carlo configurations are taken as starting points for relaxation at higher spatial resolution by Brownian Dynamics methods. The segment length is decreased to 50 nm (~5000 bp), corresponding to 20,000 segments for chromosome 15. 2000 Brownian Dynamics steps are performed until equilibration is reached again (Fig. 1, left and right).
For the simulation of a whole nucleus, 46 of the above mentioned starting configurations are put in a spherical potential representing the nuclear membrane. Depending on the segment length a nucleus consists of 200,000 to 1,200,000 segments (Fig. 5). Because of the large numbers of segments the algorithms had to be parallelized. The simulations presented here took about 9 years of CPU time on a single R6000 processor and were made on an IBM SP2/80 nodes, an IBM SP2/512 nodes, a HP Convex (S-class), and a Cray T3E/512 nodes.
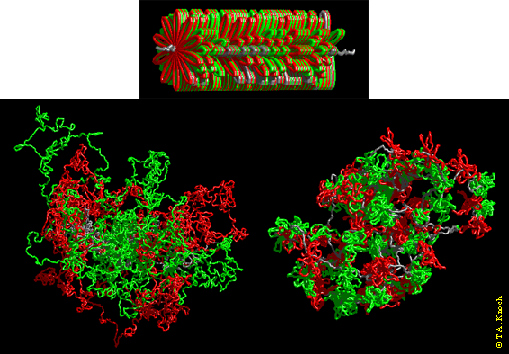
Figure 1. Visualization of chromosome 15 simulations with the Random-Walk/Giant-Loop- (RWGL) Model and the Multi-Loop-Subcompartment- (MLS) model. Consecutive loops or rosettes are painted in red and green; the linker is painted in blue. Above: Starting configuration resembling a metaphase chromosome. Left: The RW/GL - model, 5 Mbp loop size, after ~ 80,000 Monte Carlo and 1000 relaxing Browninan Dynamics steps. Large loops intermingle freely thus forming no distinct features like in the MLS — model. Right: The MLS — model, loop size 126 kbp and linker size 126 kbp, after ~ 50,000 Monte Carlo and 1000 relaxing Brownian Dynamics steps. Here rosettes form subcompartments as separated organizational and dynamic entities.
Experimental Methods:
For measuring spatial distances between genomic markers as a function of their genomic separation we chose target sequences of chromosome 15 within the region responsible for the Prader-Labhart-Willi/Angelmann (PLW/A) syndrom (c15q11.2-13.3), which is believed to be caused by a structural change in the genome, in contrast to the common base pair mutation. We used probes of about 11 kbp with separations of 18 kbp to 1 Mbp (in cooperation with K. Buetig and Prof. B. Horsthemke, Essen, FRG). Human fibroblast cells were grown on coverslips to layers, and assumed to be in the same phase of the cell cycle. The cells were fixed with paraformaldehyde in an isotonic environment, labeled with biotin and digoxigenin and were detected with fluorescent dyes bound to anti-digoxigenin and anti-biotin antibodies. Typically 25 sections per image series were then taken with a confocal laser scanning microscope (CLSM) Leica TCS NT (in cooperation with J.Rauch, H. Bornfleth, J. Bradl, C. Cremer, and and E.Stelzer, both Heidelberg, FRG). With the CLSM distance measurements between the center of mass of genomic markers with an accuracy of 35 nm are possible if each marker is detected with a different fluorescent colour and a correction is made for chromatic shift (Fig. 2).
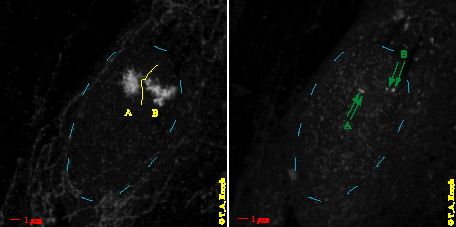
Figure 2. Fluorescent in situ hybridization (FISH) of chromosome 15 and FISH marked target sequences in the Prader-Labhart-Willi/Angelmann (PLW/A) region in the same nucleus. Left: Projection of confocal image series with `painted` chromosome 15 territories (A and B). Territories are placed behind each other and detected with a green fluorescent colour. Right: Projection of confocal image series with two target sequences with a genomic separation of 1 Mbp and marked with a red fluorescent colour in each of the territories. Territory A, two signals slightly behind each other, spatial distance 550nm. Territory B, spatial distance 840nm.
Results:
For the determination of the spatial distance as a function of genomic distance from the simulations, the spatial distance was calculated for genomic distances randomly positioned within the chain of segments and for statistically independent configurations. The mean taken over the spatial distances resulted in a standard error of the mean below 1%. In the experiments the mean was taken over 120 nuclei for each distance, and for controls 1600 nuclei were imaged. Best agreement between simulation and experiment (Fig. 3) is reached for a Multi-Loop-Subcompartment model with a loop size of 126 kbp and a linker length of again 126 kbp testing against our and K. Monier´s data (Monier et al., 1998).
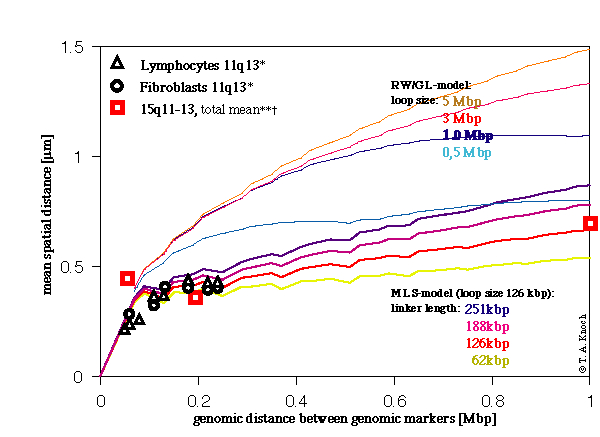
Figure 3. Comparison between experimental and simulated spatial distances versus genomic distances between genomic markers. MLS-model with a fixed loop size of 126 kbp, linker length of 63 kbp, 126 kbp, 190 kbp, and 250 kbp and in the RW/GL-model loop sizes of 5 Mbp, 4 Mbp, 3 Mbp, 2 Mbp, 1 Mbp, 500 were simulated. The linker length was adjusted in such a way that the global behaviour leads to comparable results in both models.
* Fluorescence in situ hybridization (FISH) data for both lymphocyte and fibroblast cells, chromosome 11q13, from K. Monier, Institut Albert Bonniot, Grenoble, France.
** Mean over spatial distances between genomic markers not separating homologous chromosomes.
† Our experiments (FISH) between genomic markers in the Prader-Labhart-Willi/Angelmann- (PLW/A) region.
For calculating more general properties of chromosomes the fractal dimension of the chromatin fiber was determined from the simulations. The fractal dimension was calculated as mean over independent configurations, resulting in a standard error of less than 0.3%. The fractal analysis resulted in multifractal behaviour (Fig. 4) in good agreement with predictions drawn from porous network research (Avnir, 1989; Mandelbrot, private communications).
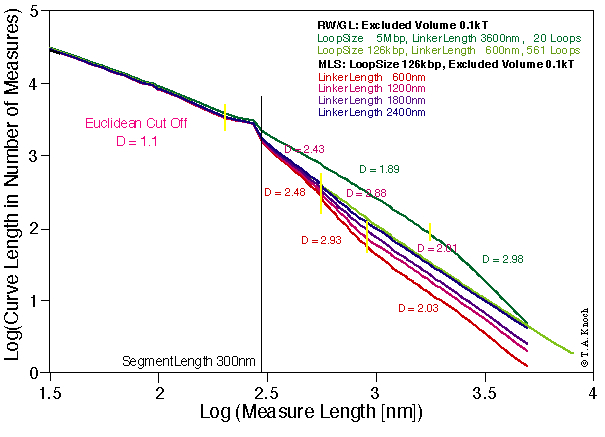
Figure 4. Fractal analysis of the Random-Walk/Giant-Loop model and the Multi-Loop-Subcompartment-model. In agreement with porous network research fractal analysis shows multifractal behaviour in simulations of chromosome 15. Different fractal dimensions mean different process-dynamics in these scale region. Thus chromosome territories show a higher implicit degree of determinism than previously thought. Standard errors of fractal dimensions are below 0.3%.
The simulation of a whole human cell nucleus in
connection with the simulation of single chromosomes resulted in the
formation of distinct chromosome territories as predicted. In contrast to
the RW/GL-model the MLS-model leads to low overlap between chromosome
territories as well as chromosome arms, in agreement with overlap analysis
of confocal image series.
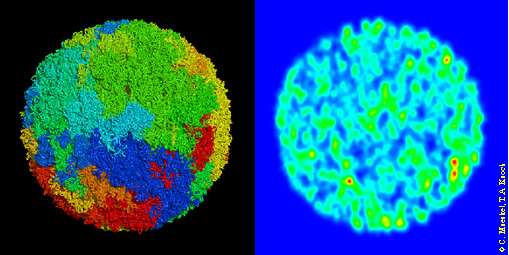
Figure 5. ´Virtual Human Cell Nucleus´ and simulated confocal section. The Nucleus is simulated assuming a flexible polymer chain, modelling the 46 chromatin fibers with in total 1,248,794 50 nm = 5.2 kbp segments. Visualizations are shown after 0.5 ms Brownian Dynamics simulation, one step taking 10 s. As starting configuration a metaphase nucleus was chosen, i. e. each chromosome was chosen as metaphase chromosome (Fig. 1, above) and homologous chromosome were placed randomly but next to each other into the nucleus. Left: Simulation of an nucleus with the MLS — model. The different chromosomes are painted with different colours. The forming of territories of chromosomes is clearly visible. Right: Simulated confocal section of the left nucleus in agreement with experiment. False colour representation.
Literature:
Avnir, David, editor, "The
Fractal Approach to Heterogeneous chemistry", John Wiley & Sons,
1989.
Boveri, T., "Die Blastomerenkerne von Ascaris
meglocephala und die Theorie der Chromosomenindiviualität", Archiv
für Zellforschung 3, 181-268, 1909.
Cremer, T., A. Kurz, R. Zirbel, S. Dietzel, B.
Rinke, E. Schr_ck, M. R. Speicher, U. Mathie, A. Jauch, P. Emmerich, H.
Scherhan, T. Ried, C. Cremer and P. Lichter, "Role of Chromosome
Territories in the Functional Compartmentalization of the Cell Nucleus",
Cold Spring Harbor Sump. Quant. Biol. 58:777-792, 1993.
Comings, D. E., "The rationale for an ordered
arrangement of chromatin in the interphase nucleus", American Jum. of
Genetics 20, 440, 1968.
Knoch, T. A., "Three-Dimensional Organization of
Chromosome Territories in Simulation and Experiments" (German),
Diploma-Thesis, German Cancer Research Center Heidelberg, Fakulty for
Physics und Astronomy, University of Heidelberg, 1998.
Monier, K., Knoch, T. A. et al.,
„Distinct distributions and morpholgy of chromosome territories in
normal lymphocyte and fibroblast nuclei during the cell cycle", (in
preparation 1998).
Münkel, Christian and Jörg Langowski,
"Chromosome structure predicted by a polymer model", Phys. Rev. E
57#5:5888-5896, 1998.
Pienta, Kenneth J. and Coffey, Donald S., "A
structural analysis of the role of the nuclear matrix and DNA loops in the
organization of the nucleus and chromosome" in Higher Order Structure in
the Nucleus, edited by P. R. Cook and R. A. Laskey, Journal of Cell
Science, Supplement I:123-135, 1984
Rabl, C., "Über Zellteilung"
Morphologisches Jahrbuch 10,214-330, 1885.
Sachs, R. K., G. van den Engh, B. Trask, H.
Yokota and J. E. Hearst, "A random-walk/giant-loop model for interphase
chromosomes", Proceedings of the National Academy of Sciences
92:2710-2714, 1995.
Zirbel, R. M., U. Mathieu, A. Kurz, T. Cremer
and P. Lichter, "Evidence for a nuclear compartment of transcription and
splicing located at chromosome domain boundaries", Chromosome Research
1:92-106, 1993.
*Corresponding Address:
Tobias A. Knoch
Division Biophysics of Macromolecules, German Cancer Research Center
Im Neuenheimer Feld 280, D-69120 Heidelberg, Germany
ph: +49-6221/423394 or 423392, Fax: +49-6221/423391
email:
[email protected]
Web: http://www.DKFZ-Heidelberg.de/Macromol/Welcome.html
|