A Biosensor for Fullerenes and Carbon Nanotubes
by
Austin N. Kirschnera, Bernard F. Erlangerb, and Stephen R. Wilson*, a
aCenter for Advanced Materials and Nanotechnology,
New York University
100 Washington Square East, New York, NY 10003
bDepartment of Microbiology, Columbia University, New York, NY 10032
*[email protected]
http://www.nyu.edu/projects/nanotechnology
This is a draft paper for the
Eighth
Foresight Conference on Molecular Nanotechnology.
The final version has been submitted
for publication in the special Conference issue of Nanotechnology.
Abstract
Surface plasmon resonance (SPR) can be used for real-time protein binding measurements with fullerenes and carbon nanotubes. Attachment of one of the interacting partners to an SPR gold sensor surface allows for consistent and repeatable binding experiments. In a typical experiment, streptavidin was adsorbed to the gold sensor and a biotinylated C60-fullerene derivative was attached. Proteins with fullerene affinity, such as our recently reported monoclonal anti-C60 antibody, could be flowed across the surface and binding data obtained. Binding experiments for anti-fullerene antibodies with several different fullerene derivatives as well as carbon nanotubes is reported.
1. Introduction
1.1 Surface plasmon resonance spectroscopy (SPR)
SPR can be used to monitor the real-time interaction between molecules at a thin metal film surface, typically gold. The surface plasmon phenomenon exists when polarized light reaches the interface between a thin metal film and a high density medium in Kretschmann geometry. The alternating electric field within the light causes oscillation of the firmly held electrons in the dielectric material. This oscillation produces evanescent waves that are non-propagating spatially decaying fields, in turn causing oscillations in the free delocalized electron density of the metal called surface plasmons [1]. Solutions and other material near or attached to the metal, on the opposite side of the incident light, alter the properties of the surface plasmons by influencing the effects of the electric fields.
Spectroscopy of surface interactions is made possible through detection of changes in the index of refraction of polarized light as it interacts with the surface plasmons. Light incident on a reflective surface obeys the Law of Reflection, which states that the angle of incidence is equal to the angle of reflectance. Light that travels through the interface between two media with material indices of refraction (n1 and n2) follow Snell's Law, which gives the relationship between the incident and refracted angles:  . The limit of Snell's law occurs when the incident light is totally reflected at the interface at a certain increased angle of incidence. The critical angle of incidence is reached when the angle of transmission increases toward 90° more quickly than the angle of incidence, resulting in light totally reflected into the high index medium. Although incident light can be totally reflected, the electromagnetic field components penetrate a short (tens of nanometers) distance into the medium of lower index of refraction, creating the exponentially attenuating evanescent wave that results in surface plasmon effects. Thus, reflection of light occurs in the apparatus being used for surface plasmon resonance spectroscopy. . The limit of Snell's law occurs when the incident light is totally reflected at the interface at a certain increased angle of incidence. The critical angle of incidence is reached when the angle of transmission increases toward 90° more quickly than the angle of incidence, resulting in light totally reflected into the high index medium. Although incident light can be totally reflected, the electromagnetic field components penetrate a short (tens of nanometers) distance into the medium of lower index of refraction, creating the exponentially attenuating evanescent wave that results in surface plasmon effects. Thus, reflection of light occurs in the apparatus being used for surface plasmon resonance spectroscopy.
Depending on the material, light incident on the metal-dielectric interface reaches its minimum in intensity of reflection at the plasmon angle, where some light interacts with the surface plasmons instead of being purely reflected. Resonance occurs when the intensity of the reflected light is reduced at the plasmon angle, due to the resonance energy transfer between the evanescent wave and surface plasmons when light is coupled to surface plasmons for a non-zero wavenumber. Light that has its electric field polarized in the plane of incidence may couple to surface plasmons and, in Kretschmann geometry, resonance occurs when wave-vector components of light and surface plasmons match. The coupling of light to surface plasmons results in absorption of the light, rather than complete reflection at the thin metal interface. The changes in intensity of reflected light is detected by a photodiode array, which records the SPR signal around the plasmon angle.
The plasmon angle is extremely sensitive to the refractive index of the solution in contact with the metal, making SPR an excellent technique for accurately measuring refractive indices, adsorption of molecules on the metallic film, and conformational changes in the adsorbed molecules with high sensitivity [2]. SPR is able to detect sub-microgram quantities of material at the metal surface. The percent intensity of the reflected incident light is higher at angles adjacent to the plasmon angle. Thus, spectroscopy surrounding this plasmon angle occurs with light incident on the metal-dielectric interface within a few degrees of its known plasmon angle.
Resonance conditions are influenced materials in contact with or adsorbed to the metal surface and the position of the SPR curve indicates the refractive index of the liquid on the sensor. Changes in detected reflected intensity of light in the incident angular region is related to changes in the index of refraction of the material or solutions on the opposite side of the metal surface, calibrated from a known index of refraction, such as 1.333 for pure water [3]. The SPR curves can be compiled into a sensorgram that describes real-time binding interactions at the metal surface. Thus, surface plasmon resonance spectroscopy uses the interaction of polarized light on a metal-dielectric with surface plasmons to determine the index of refraction of the medium on the external metal surface. The measured changes in index of refraction are often defined as resonance units. SPR can be used to detect interactions of any two molecules, although biomolecules have been primarily used [4].
1.2 Texas Instruments Surface Plasmon Resonance Spectrometer: Spreeta
The Texas Instruments (TI) surface plasmon resonance spectrometer known as Spreeta uses a small self-contained apparatus to perform all light incidence activities and measure reflective angles with established Kretschmann geometry. In the Spreeta device, the light used is produced from a light-emitting diode (LED) in the near infrared wavelength of 840 nm. The light is immediately plane polarized and incident on the gold metal-dielectric interface. The externally facing gold surface (a few hundred angstroms thick with a length of 4.5 mm and a width of 0.1 mm) is contained within an airtight channel in which solutions can flow. To account for non-uniformity in the gold surface the sensor is first initialized in air, and the SPR curve is determined by normalizing the signal in liquid with the signal in air. Materials can be covalently linked or become adsorbed to the gold surface, and solutions containing analytes of interest flowed across the surface can be detected by direct binding of molecules to the surface.
The TI Spreeta is connected to a PC through a serial port, and user interface software controls the device's settings and collects the data in real-time. Raw data is saved in data files, which can be imported into a spread sheet program for further detailed analysis. A linear relationship can be found between resonance energy and the mass concentration of biochemically relevant molecules, such as proteins, DNA, and sugars, attached to or near the gold surface. The SPR signal can be directly interpreted as analyte and ligand association or dissociation at the surface. Ultimately, rate constants and equilibrium constants can be calculated.
Small thermal variations in the environment, samples, and buffers are compensated by a small integrated thermistor monitoring the temperature at the sensing surface. Mechanical drift is minimized by the rigid assembly of the Spreeta system. TI has demonstrated the limitations and wide range of experiments made possible by the Spreeta device, including a dynamic range of 1.320 to 1.368 refractive index units (RIU) with a resolution of 5 x 10⁻⁶ RIU using 16 averages [5].
1.3 Properties of fullerenes and carbon nanotubes
Fullerenes and carbon nanotubes are composed of only carbon atoms, which makes them hydrophobic and non-polar. For the study of proteins and their interaction with fullerenes by SPR, aqueous solutions with water-soluble fullerene derivatives are required. Carbon nanotubes are similarly hydrophobic. However, their large size allows sonication to disperse and solvate carbon nanotubes in aqueous solutions as colloids. Extremely dilute samples can have nanotubes that are so dispersed that they can be considered completely dissolved. Thus, pristine carbon nanotubes can be solubilized in aqueous solutions to allow them to be used in the Spreeta system.
The spherical structure of fullerenes makes them have high molecular weights for relatively small volumes. For example, C60 has a molecular weight of 720 amu, but only occupies a spherical atom-to-atom volume having a diameter of 7.2 nm (1 nm including Van der Waals radius) [6]. This must be considered when dealing with detection of mass and the effects of volume in surface plasmon resonance. The high molecular masses must be factored in when considering the changes in index of refraction of the light in the surface plasmon resonance. Furthermore, the rigidity of both fullerenes and carbon nanotubes assures that the structures will remain compact and undisturbed by proteins or other molecules in the detection system. These nearly inert mostly carbon molecules should interact with proteins in solution and bound to the surface in ways never before observed.
1.4 Monoclonal anti-fullerene antibody
Monoclonal antibodies have been prepared for many antigens and molecules of interest [7,8]. Small molecules, such as fullerenes, are not normally recognized by the immune system and do not trigger the production of antibodies by themselves. In fact, due to the small size, inert character, and structural stability, fullerenes have extremely low toxicity, even at relatively high in vivo concentrations [9].
To produce an antibody with specificity for fullerenes, a fullerene-hapten molecule was designed and linked to a large foreign protein, such as bovine serum albumin (BSA), rabbit serum albumin (RSA), or bovine thyroglobulin. The preparation of a monoclonal antibody specific for C60 has been previously reported [10,11]. Using an enzyme-linked immunosorbent assay (ELISA), a monoclonal antibody with high specificity for C60-fullerene could be isolated (Figure 1).
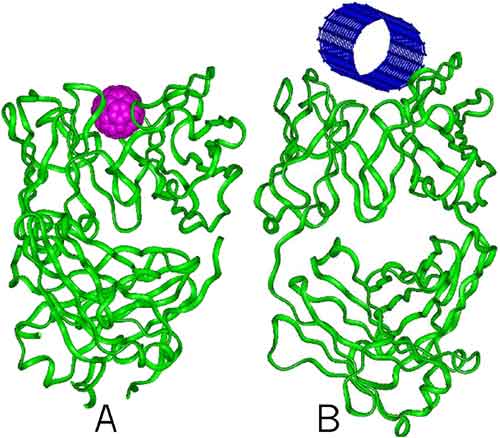
larger picture |
| Figure 1. (A) C60 fullerene binding to monoclonal antibody with specificity for C60-fullerene. (B) [10,10]-tube binding to modified anti-C60 antibody |
The anti-fullerene antibody has been tested by biological techniques that determine its binding specificity for various fullerenes, fullerene derivatives, and carbon nanotubes. In accordance with expectations, the antibody binds to the fullerene sphere, rather than attached side chains. For example, a C60-dendrimer fullerene derivative synthesized by Hirsch and coworkers [12] has a significantly lower IC50 value than the C3 and D3 tris-malonate derivatives. Mono-fullerene adducts bind better than tris-fullerenes adducts, possibly because more of the carbon sphere is accessible to the antibody-binding site. Molecular modeling performed on the binding of C60 and several fullerene derivatives to the antibody agree with this experimental observation [13]. Furthermore, the antibody has been shown to bind strongly to carbon nanotubes, since they possess similar properties to fullerenes (unpublished observations).
Experimental binding studies of the anti-fullerene monoclonal antibody has previously only been performed using standard biological techniques. Extensive molecular modeling has resulted in theoretical corroboration of the experimental data. This work presents the first binding data of the antibody using real-time surface plasmon resonance methods. In addition, binding data for several molecules that have not been previously tested are presented herein. Surface plasmon resonance allows for testing and analysis of binding in a relatively easy, fast, and repeatable manner.
2. Experimental Procedures
2.1 Synthesis of a biotinylated fullerene
The synthesis of C3-trisamine-C60 (molecule 1) has previously been reported [14]. Modification of 1 was accomplished as depicted in Scheme 1 to produce the biotinylated fullerene, molecule 2. [15] This preparation will be reported elsewhere.
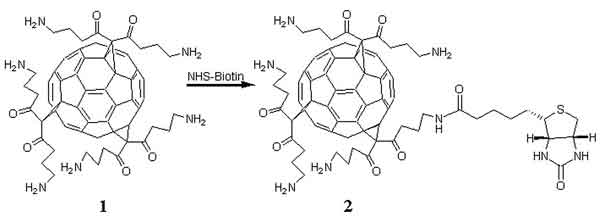
larger picture |
| Scheme 1. Attachment of biotin to a C3-symmetric trisamine C60-fullerene (1) to form a biotinylated fullerene derivative (2). |
2.2 Preparation of sensor surface and adsorption of streptavidin
Physical cleaning of the Spreeta gold sensor surface is required before assembly of the flow cell for binding studies. The gold surface was cleaned by removal of macroscopic dirt particles by applying pure deionized water, 100% ethanol, and 0.1 M NaOH in 1% Triton X-100 in H2O, in alternating solutions, gentle wiping with a soft Kim wipe (Kimberly-Clark, Roswell, GA) and drying with nitrogen gas. The flow cell was assembled according to the Spreeta User's Manual [16] using the standard Teflon block with a small black O-ring sealing the gold sensor channel. A syringe pump was connected to the flow cell through a short length of tubing, allowing solutions in 10-mL disposable plastic syringes (Becton Dickinson, Franklin Lakes, NJ) to be delivered across the sensor surface.
Buffers and detergent solutions must be used to clean the sensor surface before biomolecules can be adsorbed on the gold. Buffers used to clean the sensor and flow all solutions for the protein binding experiments included purified deionized water and phosphate-buffered saline (PBS), pH 7.0-7.2 (GibcoBRL, Gaithersburg, MD). The changes in index of refraction during a typical solution cleaning procedure for a newly assembled Spreeta sensor with the flow cell apparatus are depicted in Graph 1.
larger picture |
| Graph 1. Typical cleaning of gold sensor surface by washing with successive flows of H2O, (A) 0.1 M NaOH in 1% Triton X-100 in H2O, (B) H2O again with (C) recalibration to 1.333, and (D) final PBS baseline, followed by (E) adsorption of Neutravidin. |
The first 600 seconds in Graph 1 indicates the stable pre-clean baseline flow of deionized water at 7.2 µL s-1 arbitrarily set at 1.333. At point A, the flow was switched to a detergent solution of 0.1 M NaOH in 1% Triton X-100 (Sigma-Aldrich, St. Louis, MO) in water for 10 minutes. At point B, water was flowed again, and the index of refraction was allowed to decrease to a stable value below the original pre-clean baseline. This stable index of refraction value is the real index of refraction of water for a clean gold surface, and was reset to 1.333 to reflect this fact at point C. At point D, the flow was changed to PBS for 10 minutes. A 100 µg mL-1 solution of purified streptavidin protein known as Neutravidin (Pierce, Rockford, IL) in PBS was flowed across the surface at a rate of 0.72 µL s-1 at point E. Adsorption of Neutravidin was allowed to progress until saturation at a stable index of refraction value was observed. Subsequent flow of PBS only did not decrease the index of refraction.
2.3 Binding of a biotinylated fullerene
At a concentration of 180 µg mL-1, compound 2 dissolved in PBS was flowed across the sensor surface at 5 - 6 µL s-1. The solution (total volume of 10 mL) was recirculated through the flow cell for 40 minutes. A rinse for 10 minutes (10 - 12 µL s-1) with PBS followed. At this point, the sensor was primed to detect binding proteins to C60. The change in index of refraction by the binding of compound 2 to streptavidin on the gold biosensor surface versus time is contained in Graph 2. (The flow was changed during the time gap indicated on the graph.)
larger picture |
| Graph 2. Binding biotinylated fullerene compound 2 to streptavidin adsorbed to the gold sensor surface, (A) beginning and (B) ending with PBS flows. |
2.4 Binding anti-C60 antibody to fullerene on biosensor surface
After the baseline was established by flowing PBS at 10 - 12 µL s-1 for 10 minutes, a solution of anti-C60 antibody [17] 4 µg mL-1 (20 µL of a 2 mg mL-1 solution, diluted in 10 mL of PBS) was recirculated through the system at 5 - 6 µL s-1 until the index of refraction measurements reached a plateau level. Extra time was allotted to compensate for flow impedance, mass transport, and the alignment of the binding site with fullerene ligand. Afterwards, PBS buffer was run through the flow cell system across the sensing surface for 10 minutes (10 - 12 µL s-1) to remove all traces of the bulk antibody solution and establish a final binding index of refraction baseline. Graph 3 shows index of refraction data gathered during typical anti-C60 antibody binding. The expected arrangement of biomolecules on the Spreeta sensor surface after the antibody is bound is depicted in Figure 2.
larger picture |
| Graph 3. Typical binding of anti-C60 antibody to fullerene 2 on biosensor surface. |
larger picture |
| Figure 2. Cartoon of molecules on biosensor surface. Figure not representative of scale of molecules, except where indicated. |
2.5 Competition experiments
The data gathered from two typical competition binding experiments involving preformed solutions of anti-C60 antibody and a water-soluble fullerene are presented in Graph 4. In curve A, a solution of both compound 1 and anti-C60 antibody in PBS was flowed across the surface that has Neutravidin-bound compound 2 already on it. The final change in index of refraction was less intense than binding of anti-C60 antibody alone. Similarly, a solution of the antibody and the water-soluble C60-dendrimer produced a significantly smaller change in index of refraction, as curve B indicates.
larger picture |
| Graph 4. Typical solution phase competition binding experiments using preformed solutions of anti-C60 antibody and a water-soluble fullerene. Curve A shows using molecule 1 and curve B shows using the C60-dendrimer [12]. |
3. Discussion
Before performing any data analysis, the SPR curve was smoothed by a least-squares method that incorporated one point on either side of a data point [18,19]. This reduced the noise when tracking refractive index versus time.
The preliminary binding experiments described herein involved procedures quite similar to those presented by Texas Instruments in the supplementary information supplied for the Spreeta device [20]. The first experiment involved the cleaning of the gold sensor surface, adsorption of streptavidin, and subsequent attachment of the biotinylated fullerene, molecule 2. This was successful and corresponded to data presented in the Spreeta preliminary information. The SPR data indicating binding of material to the biosensor was supplemented by comparison of UV-Vis absorption spectra of solutions before and after they were used, revealing consistent decreases in absorption intensity corresponding to the material deposited on the sensor surface (data not shown).
Small molecules are more difficult to detect because they contribute only small changes in mass to a solution, giving also only minimum refractive index changes [21]. For this reason, a fullerene was immobilized on the sensor rather than the fullerene binding protein so that larger SPR signals would result. The molecular weight of the anti-C60 antibody is about 150 000 (150 kDa), whereas a typical fullerene derivative has a molecule weight of 1000 to 3000 (1 to 3 kDa).
Control binding experiments were performed to check for possible non-specific binding interactions. Bovine serum albumin (BSA) (Sigma-Aldrich, St. Louis, MO) was used as a substitute protein for all phases of the binding interaction tests. BSA was used to check for non-specific protein-protein interactions that might exist between streptavidin and the antibody. In addition, without fullerenes present the antibody had only small non-specific interactions with streptavidin on the biosensor surface. There was no significant binding for non-biotinylated fullerenes to streptavidin on the gold sensor surface. Data from all these experiments never contradicted the data gathered for successful binding of the antibody to fullerenes. Finally, flows of detergents after binding experiments confirmed that only specific binding interactions existed.
Binding anti-C60 antibody to the biotinylated-fullerene on the biosensor surface resulted in an average change in index of refraction of 1.4 x 10⁻³ RIU. The concentration of antibody used in the binding experiments was shown to be more than sufficient to reach saturation of binding, since consistent results were achieved upon repeated use of the same antibody solutions.
The data presented in Graph 4 indicate that C60-dendrimer binds to the anti-C60 antibody better than molecule 1. The smaller overall increase in index of refraction shows that solution phase binding is more competitive with C60-dendrimer [11] in solution than molecule 1.
Finally, preliminary experiments with carbon nanotubes indicate that they can be detected by SPR in experiments similar to those performed with fullerenes. The experiments showed that the anti-C60 antibody binds strongly to very dilute solutions of single-walled carbon nanotubes (SWNTs, from tubes@rice) in PBS. In fact, the binding of the antibody to SWNTs produced a larger change in index of refraction than for binding to fullerenes, (data not shown). While part of the reason for the strong SPR signal could be due to the high mass of SWNTs, there also may be more binding sites for the antibody and more "irreversible" binding interactions between the antibody and SWNTs. Further research in this area is currently in progress.
4. Conclusions
The data presented in this paper show that a biosensor surface can be prepared that detects the binding of fullerenes and carbon nanotubes. The qualitative analysis of these experiments demonstrates the extent of antibody-fullerene binding through surface and solution phase interactions. The data from these binding experiments will be rigorously analyzed to determine useful quantitative information, such as stoichiometry of interaction, association and dissociation binding constants, and equilibrium constants. Data and techniques presented in this paper, and future SPR experimentation, will improve our understanding of fullerene-protein interactions and provide new tools for nanotube analysis.
5. References
[1] Wang Y 1995 Appl. Phys. Lett. 67 2759-2761
[2] See information at http://plasmon.fiu.edu/spr
[3] Refractive index relative to air at 20°C with 589 nm light. 1972 American Institute of Physics handbook ed Gray D E (New York: McGraw-Hill)
[4] (a) Parsons I D, Persson B, Mekhalfia A, Blackburn G M and Stockley P G 1995 Nucleic Acids Res. 23 211-216 (b) Parsons I D and Stockley P G 1997 Anal. Biochem. 254 82-87 (c) Stockley P G, Baron A J, Wild C M, Parsons I D, Miller C M, Holtham C A M and Baumberg S 1998 Biosensors. Bioelect. 13 637-650
[5] (a) Elkind J L, Stimpson D I, Strong A A, Bartholomew D U and Melendez J L 1999 Sensors and Actuators B 54 182-190 (b) Kukanskias K, Elkind J, Melendez J, Murphy T, Miller G and Garner H 1999 Analytical Biochem 274 7-17
[6] Wilson S R 2000 Biological Aspects of Fullerenes (Fullerenes: Chemistry, Physics, and Technology), ed K M Kadish and R S Ruoff (New York: John Wiley & Sons) p 439
[7] Ku H H, Cleveland W L and Erlanger B F 1987 J. Immunol. 139 2376-2384
[8] Ownby D R, Ownby H E, McCullough J and Shafer A W 1996 J. Allergy Clin. Immunol. 97 1188-1192 Also, see article at http://www.cdc.gov/niosh/latexalt.html
[9] Moussa F, Trivin F, Céolin R, Hadchouel M, Sizaret P-Y, Greugny V, Fabre C, Rassat A and Szwarc H 1996 Full. Sci. Tech. 4 21-29
[10] Chen B-X, Wilson S R, Das M, Coughlin D J and Erlanger B F 1998 Proc. Natl. Acad. Sci. USA 95 10809-10813
[11] Braden B C, Goldbaum F A, Chen B-X, Kirschner A N, Wilson S R and Erlanger B F 2000 Proc. Natl. Acad. Sci. USA 97 12193-12197
[12] Brettreich M and Hirsch A 1998 Tetrahedron Lett. 27 2731
[13] Chen B-X, Braden B C, Erlanger B F, Kirschner A N and Wilson S R 2000 Proc. Electrochem. Soc. 9 233-239
[14] Richardson C F, Schuster D I and Wilson S R 2000 Org. Lett. 2 1011-1014
[15] Synthesized and supplied by C. F. Richardson (Department of Chemistry, New York University, NY)
[16] Spreeta User's Manual, Texas Instruments, Inc., August 1999.
[17] Generously donated by B F Erlanger and B-X Chen (Department of Microbiology, Columbia University, NY)
[18] Savitzky A C and Golay M J E 1964 Analytical Chem. 36 1627-1639
[19] Savitzky A C and Siggia S 1972 Analytical Chem. 44 1906-1909
[20] See TI Spreeta website at http://www.ti.com/spreeta
[21] Vangent J, Lambeck P V, Kreuwel H J M, Gerritsma G J, Sudehölter E J R, Reinhoudt D N and Popma Th J A 1989 Sens. Actuators 17 297-305
Acknowledgments
We would like to thank NASA Graduate Student Researchers Program for financial support. We are very appreciative of the helpful correspondence and technical assistance concerning TI Spreeta provided by Jerry Elkind, Anita Strong, Dwight Bartholomew, and other members of Texas Instruments, Inc.
|