There is at Technology Review’s arXiv blog an article “How to find bugs in giant software programs.” It’s an overview of a paper on arXiv which is a statistical study of program sizes and bug distributions in the Eclipse dataset of Java programs.
TR says,
So how are errors distributed among these programs? It would be easy to assume that the errors are evenly distributed per 1000 lines of code, regardless of the size of the program.
Not so say Marchesi and co. Their study of the Eclipse database indicates that errors are much more likely in big programs. In fact, in their study, the top 20 per cent of the largest programs contained over 60 per cent of the bugs.
Now this is something I was very happy to believe, since it accords with my own instincts on the matter. Big programs are surely more complex internally and thus easier to make mistakes in, after all. So I sat down to write a post about how things should be kept small, big systems are dangerous and error-prone, and so forth, with dire implications for the design of the enormously complex nanosystems of the coming century. But for some reason I decided to go to the paper and see just how much more error-prone those big modules are.
Here’s what the paper says:
… We also find that a small percentage of largest programs account for a large
percentage of defects, and the number of defects across programs follows the Weibull
distribution when the programs are ranked by their sizes.
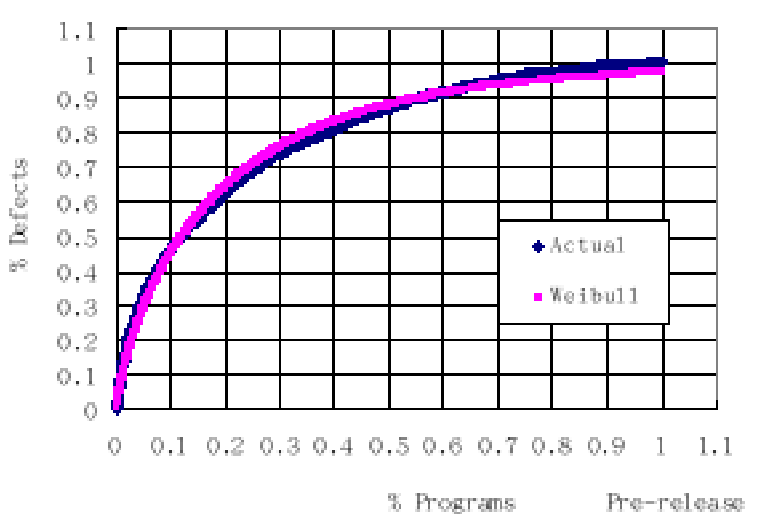
And sure enough, that’s what the graph shows: sort the modules from largest to smallest, and the number of errors per program follows the Weibull distribution quite nicely. If each program had the same number of bugs, the plot would go straight from (0,0) to (1,1). But that would be very surprising, since there are more lines of code in large programs and so even at a flat error density, there’d be more bugs. The curve pretty much has to rise above a straight line; the question is how much?
Marchesi et al confirm that program size in the systems they study follows a lognormal distribution, so I used the excellent open-source R statistics language to model such a system assuming a uniform probability of errors per line of code:
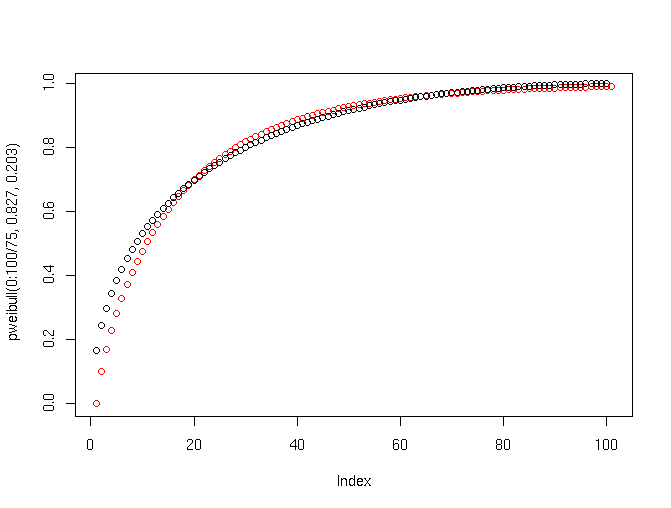
Red dots are the Weibull distribution, corresponding to the purple curve above, and black dots are the model.
Looks awfully similar — in fact, even the mismatch has the same pattern, which means they might have gotten a slightly better fit with an error model that was simply linear in program size.
As far as I can see in the paper, Marchesi et al do not say anything about error density — they just point out bigger programs have more bugs, and don’t try to quantify the relationship. The closest thing they say is
The results confirm that, by simply ranking the programs according to their sizes, a large number of defects can be located. The results also suggest that, in software quality assurance practices (such as inspection, formal review meeting, and testing), if initial efforts are centered on the largest programs, a large percentage of defects could be identified earlier.
That would be true if one big program were easier to check than a bunch of small ones with the same total lines of code, e.g. if there were a per-program overhead.
But the numbers show errors per line of code as essentially flat. Which means that bugs go up linearly with total system complexity, regardless of inner structure. Which is good news for complex nanosystems.