It’s a question of some interest whether the Singularity will consist of just more exponential growth, or whether some superexponential growth mode is likely to happen (or is even possible), such as would be required for a real mathematical singularity.
On the side of exponential growth, as I pointed out here, is the fact that just about every actual mechanism for growth is actually exponential. The exceptions are exogenous: instead of something growing, some outside outside phenomenon is adding to what is counted as the something. In some corners of economics, trading and speculation analysis in particular, this is known as “herding.”
Now I’ve argued for years that that would in fact happen in AI over approximately the coming decade. The cause would be that as the capabilities of AI moved up across some threshold of effectiveness, mainstream investors would become interested and begin to pour money into it.
A super-exponential is not easy to tell from an exponential looking at a regular graph. They both take off through the roof on a big enough scale. But if you graph them on a log scale, the exponential is always a straight line, and the super-exponential curves upwards. Thus, the shift between one ordinary exponential growth mode and another with a higher exponent will be a super-exponential fillet curve between the two straight ones representing the successive growth modes on a log scale.
It turns out, unfortunately, that super-exponentials are far from rare in the market, and they generally do not mark the shift from one growth mode to another. Far to the contrary, they usually reflect that self-organized form of a Ponzi scheme called a market bubble.
It turns out that the herding effects leading to bubbles can often be recognized by fitting the market to an oscillating super-exponential called a “log-periodic power law.” Consider this paper, for example:
We present a self-consistent model for explosive financial bubbles, which combines a mean-reverting volatility process and a stochastic conditional return which reflects nonlinear positive feedbacks and continuous updates of the investors’ beliefs and sentiments. The conditional expected returns exhibit faster-than-exponential acceleration decorated by accelerating oscillations, called “log-periodic power law.” Tests on residuals show a remarkable low rate (0.2%) of false positives when applied to a GARCH benchmark. When tested on the S&P500 US index from Jan. 3, 1950 to Nov. 21, 2008, the model correctly identifies the bubbles ending in Oct. 1987, in Oct. 1997, in Aug. 1998 and the ITC bubble ending on the first quarter of 2000. Different unit-root tests confirm the high relevance of the model specification. Our model also provides a diagnostic for the duration of bubbles: applied to the period before Oct. 1987 crash, there is clear evidence that the bubble started at least 4 years earlier. We confirm the validity and universality of the volatility-confined LPPL model on seven other major bubbles that have occurred in the World in the last two decades. …
They’re not just blowing smoke. LPPL analysis predicted the US housing bubble in this 2005 paper, for example. More recently, it predicted the crash in Chinese equity markets with a remarkable timing accuracy. (h/t TR arXiv blog)
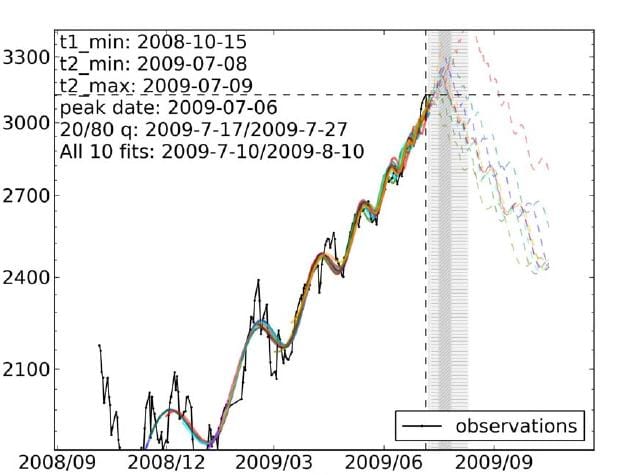
Here was the prediction:

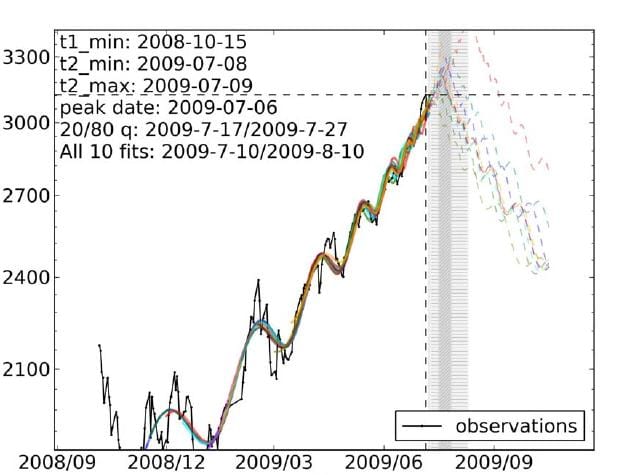
and here’s what actually happened:

So the big question is, when we see super-exponentials developing in AI or nanotech, which will be happening?
